
 The Labs
Formula 1 modelling: what a lap simulator and race data can and cannot tell us
We built an F1 lap simulator on public 2026 track data from OpenF1, and used it to ask whether the new 2026 rules leave room for gains. We also studied pit-stop strategy in public race data from 2023 to 2026. We use no team data and make no claim about real cars.

The simulator shows a robust but modest gain that is within its own model error. It is not a discovery.
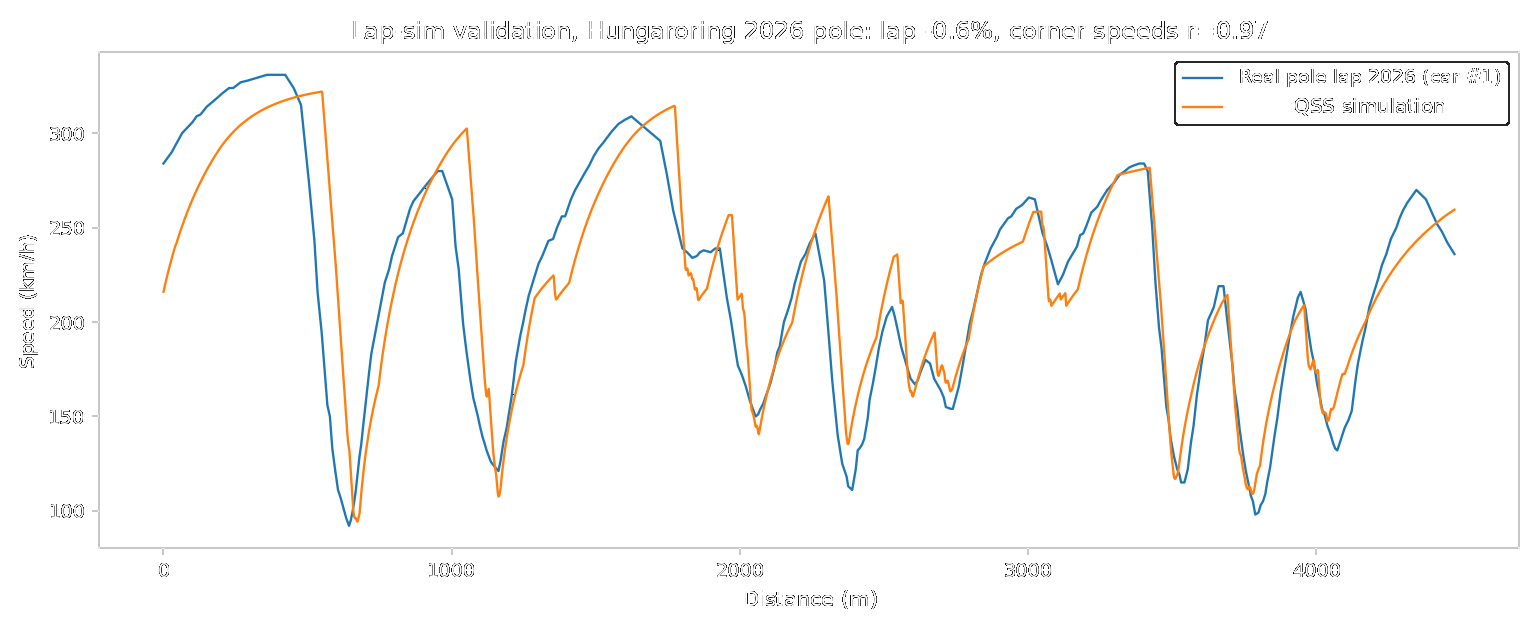
The simulator was fitted on one track (Hungaroring) with four constants. Against the real 2026 pole lap there, the simulated lap time was 0.6% off and corner speeds correlated at r=0.97. It then predicted three other tracks without refitting: Monza +0.95%, Silverstone +1.88% and Spielberg +2.07% error in lap time, which passed. Catalunya (+3.37%) and Mexico (-3.99%) failed and were excluded and reported. Overall model error is about 2.7%, roughly 2 seconds per lap. The fit also cannot separate grip from downforce with public data, so absolute numbers are soft.
In our simulator, not on a real car, we searched for the best energy deployment, corner downforce, straight-line drag cut and engine power against a fair baseline, not a weak one. The simulated lap-time gain stayed positive in 100 of 100 random changes of grip, downforce, drag and energy by up to 10%.
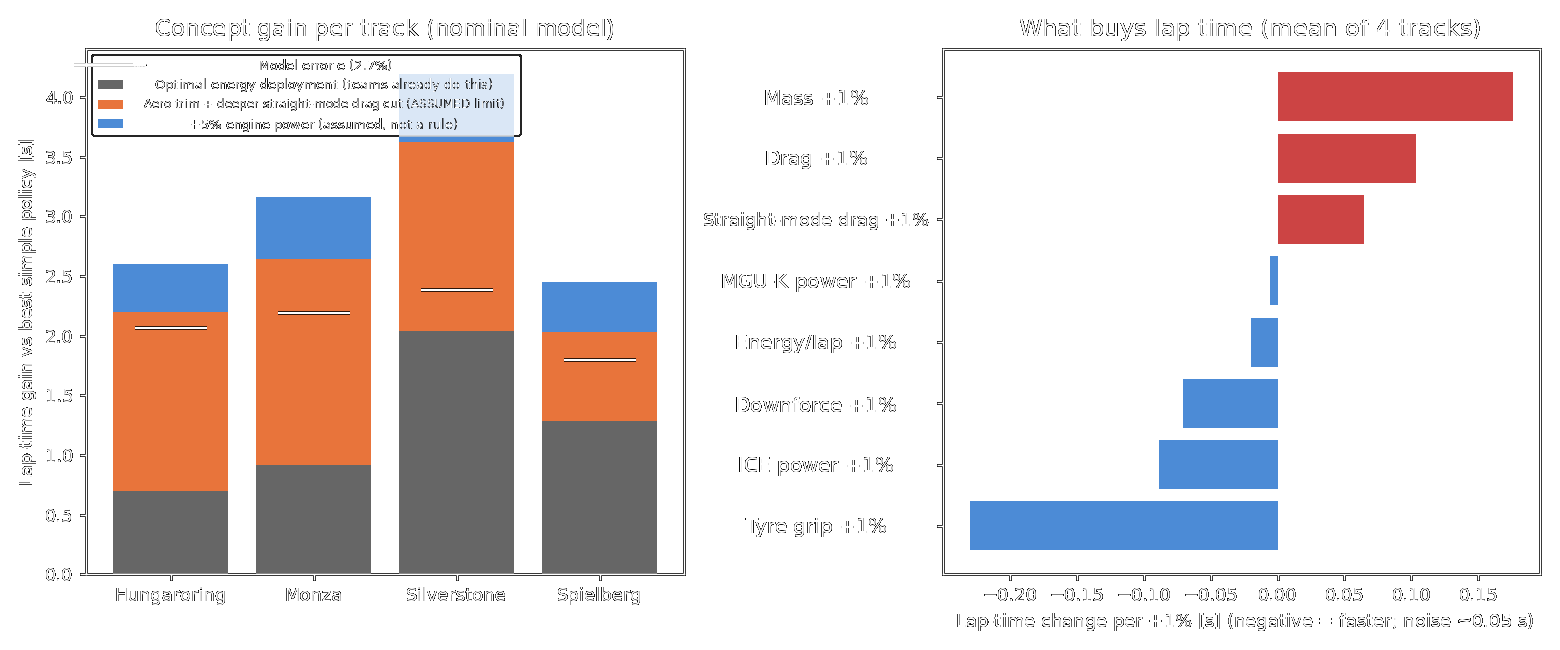
These are model numbers, not real-world performance. Most of the gain is known practice: optimal energy deployment gives 0.7 to 1.7 s, and teams already do this. The part beyond known practice, 0.8 to 1.6 s from aero trim and a deeper straight-mode drag cut, is smaller than the model error of about 2 s. It rests on one assumption: that the straight mode can cut drag by 45% instead of 30%. Whether that is legal or feasible was not checked. The honest label is robust positive, within model noise, not decisive. The right-hand panel is a more reliable reading: in the model, tyre grip and engine power buy more lap time per percent than anything else, and extra mass and drag cost the most.
In 299 pit-stop battles from 2023 to 2025, an undercut (pitting first to gain time on fresh tyres) worked about 90% of the time when the chaser started less than half a second behind, and flipped to failing at a gap of about 1.7 s (95% interval 1.5 to 2.1 s). If the leading car covered on the very next lap, the early stopper succeeded only 38% of the time. If it waited 3 to 9 laps, the early stopper succeeded 75 to 76% of the time. Success also depends on the track: 86% at Hungaroring against 25% at Lusail (small samples, 8 to 28 cases per track).
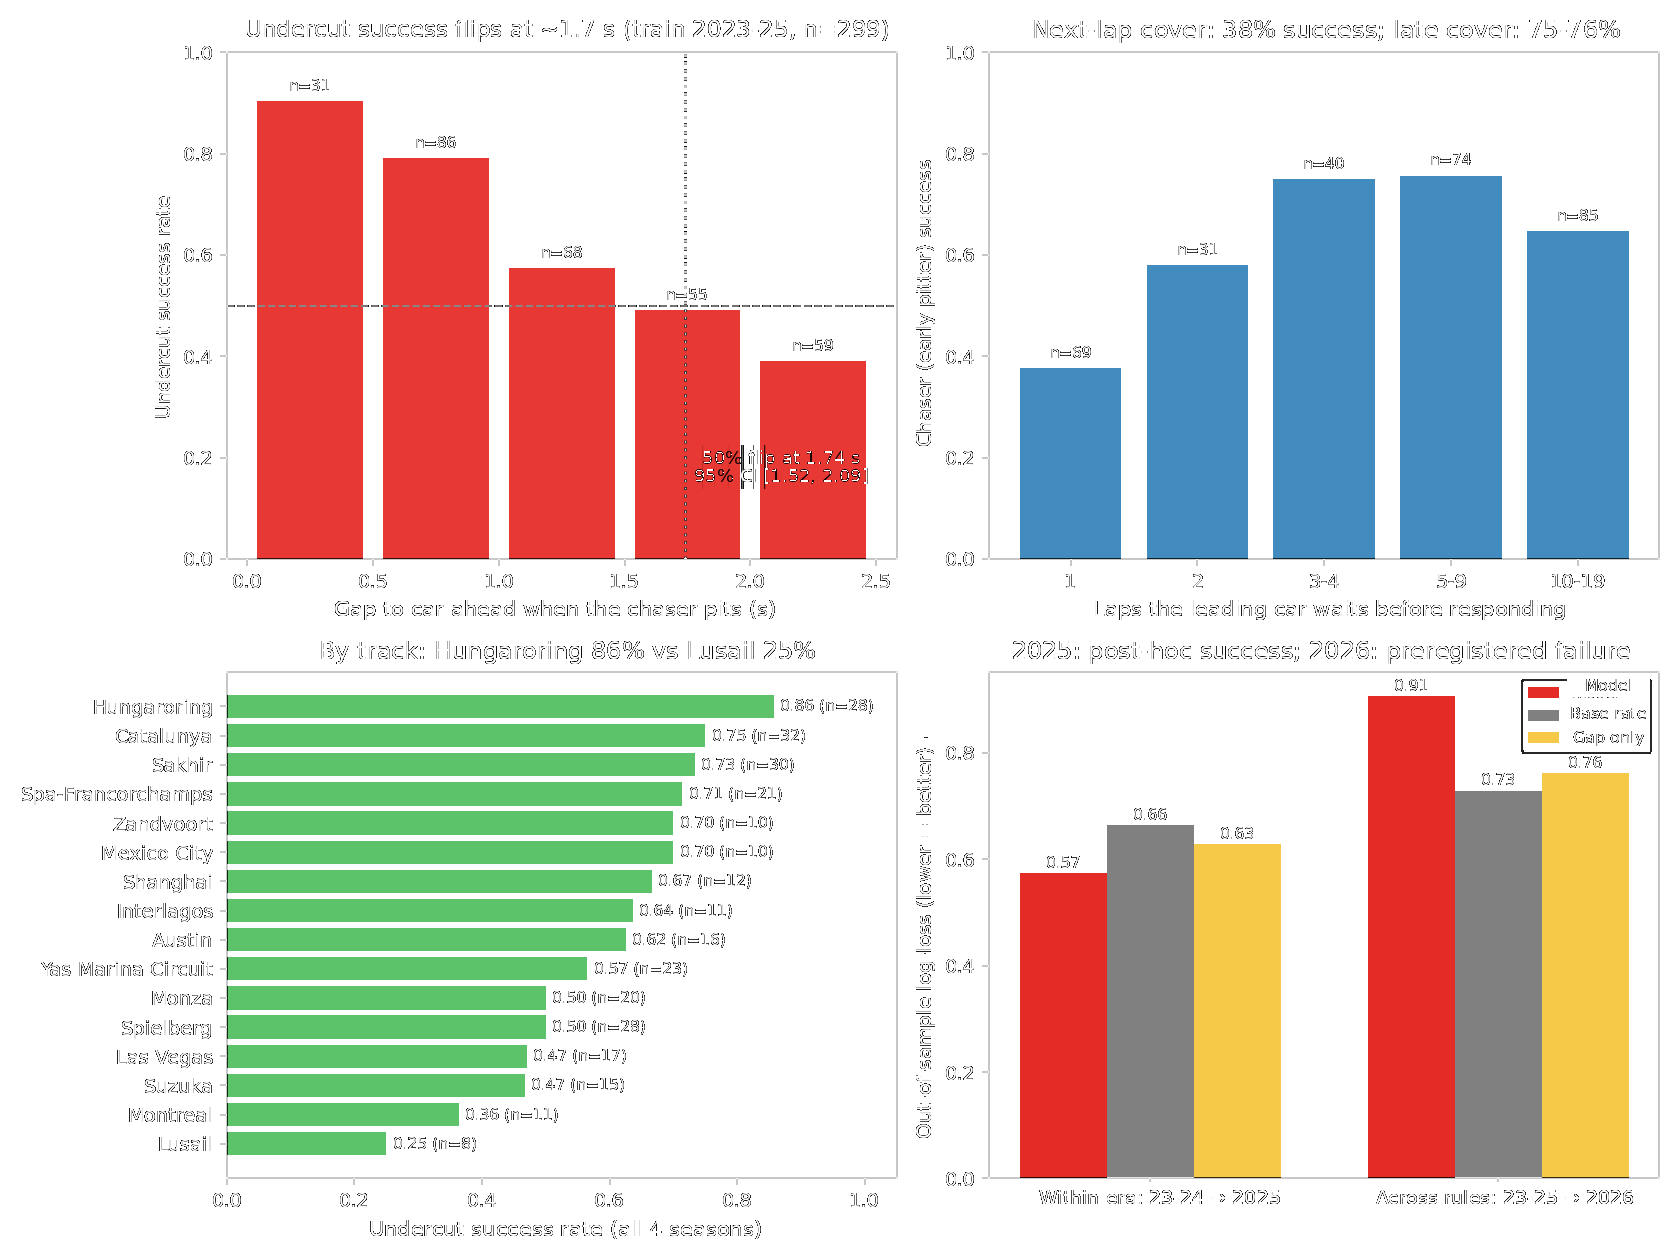
The model beats simple baselines inside one rule era (log-loss 0.57 against 0.66 for the base rate, lower is better). Across the 2026 regulation change it breaks: 0.91 against 0.73 for the base rate. A model trained on 2023 to 2025 should not be trusted for 2026 until it is refitted.
- Anomaly hunt, round 1: negative. A slipstream effect of about 8 km/h and "no 2026 change" are exploratory associations, not findings. A planned second round never ran.
- Public data only, a fitted simulator with about 2 s error, five tracks.
- Simulated gains are not real-world performance. No causal claim about any team or driver.
- Strategy figures use small samples per track and apply to 2023 to 2025 rules.